Google Analytics 4 (GA4) is the future of data analytics and it has revolutionized the way businesses track and analyze user interactions on their websites and apps. Unlike its predecessor, GA4 reports focuses heavily on user behavior across various devices, giving businesses a complete view of customer journeys. This blog will cover the main types of google analytics reports, helping you understand their functionality, purpose, and how they can aid in data-driven decision-making.
1. Real-Time Reports
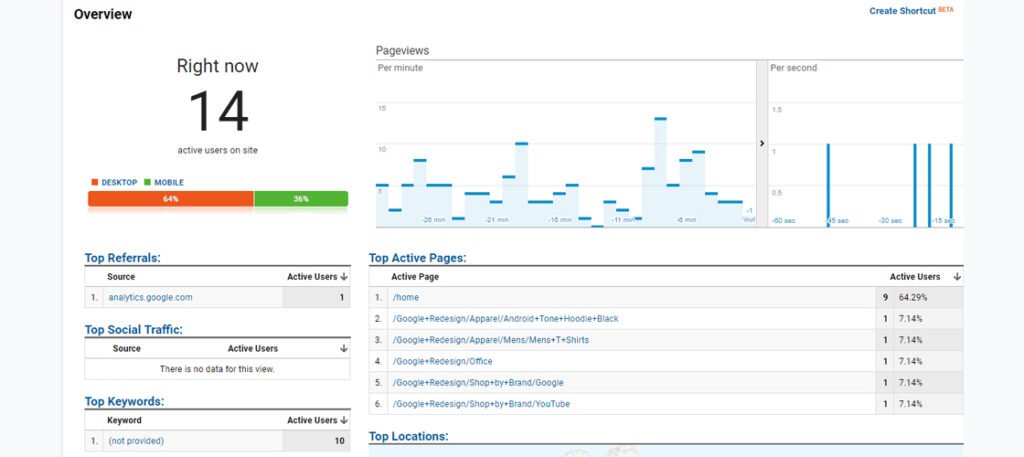
Overview: Real-time google analytics reports provide an immediate snapshot of user activity on your website or app, allowing you to track how users interact with your content as they engage in real-time. This is essential for tracking sudden changes, monitoring live campaigns, and assessing the immediate impact of new content or promotions.
Key Features:
- User Activity: Observe live users on the site, tracking events, page views, and conversions as they occur.
- Geographic Data: See which regions users are from, helping you adjust your regional marketing efforts if necessary.
- Top Events: Gain insight into which actions are being taken most frequently in real-time, such as clicks, downloads, and other defined events.
Use Cases:
- Campaign Monitoring: Gauge the impact of a campaign launch or special promotion and make adjustments as needed.
- User Behavior: Detect any unexpected behavior, allowing quick responses to issues like unexpected traffic spikes or drops.
2. Lifecycle Reports
GA4’s Lifecycle Reports track the user journey across different stages of interaction. They are structured to align with the natural progression of user engagement and provide insights that can improve both acquisition and retention strategies.
a. Acquisition Reports
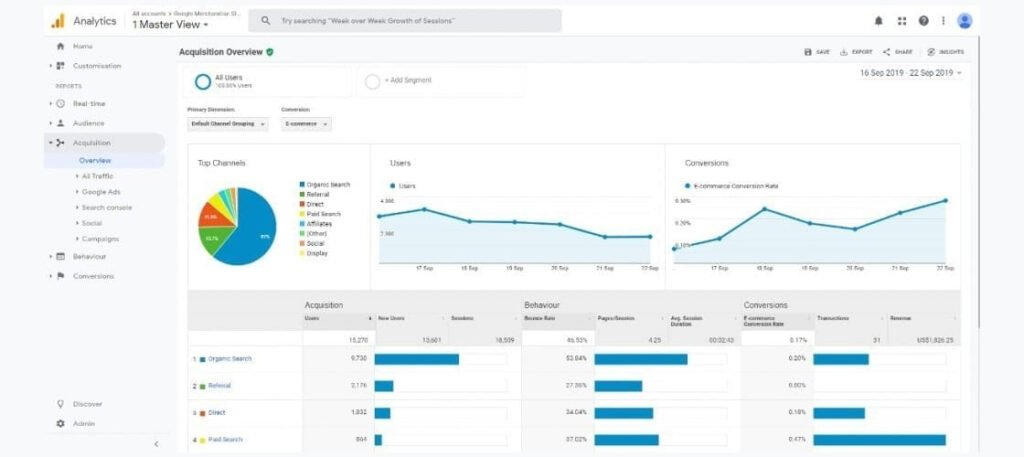
Overview: These reports track how users are arriving at your website or app, breaking down traffic by channel, source, and medium. With acquisition GA4, you can track both user and session acquisition.
Key Metrics:
- User Acquisition: Tracks new users by the sources or campaigns that brought them to your site.
- Session Acquisition: Tracks individual sessions by sources, allowing for analysis of repeat and returning visitors.
Use Cases:
- Channel Effectiveness: Evaluate which channels are driving the most high-value users.
- Marketing Optimization: Refine your budget by focusing on channels that generate the most new users.
b. Engagement Reports
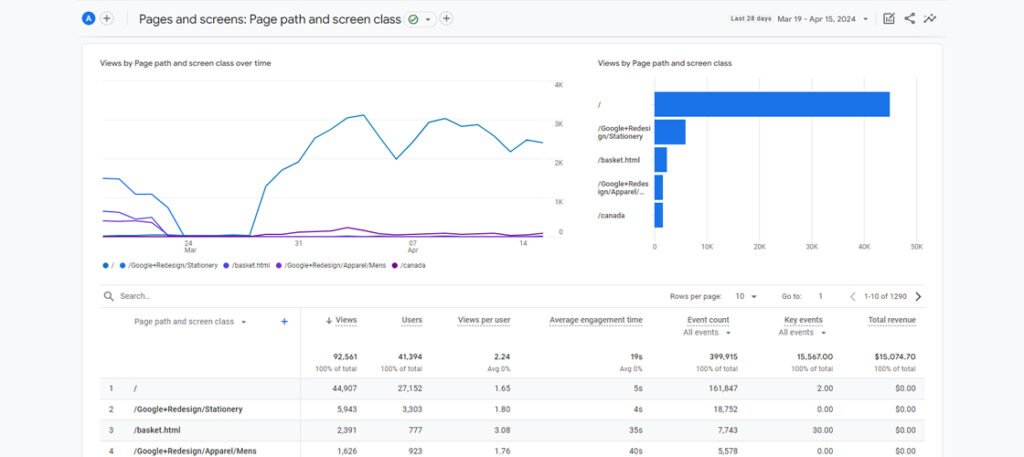
Overview: Engagement reports in google analytics 4 measure how users interact with content once they arrive on the website or app. This includes data on the amount of time spent on the site, specific user events, and how deeply they explore your content.
Key Metrics:
- Engagement Rate: Percentage of sessions that are “engaged,” meaning they last longer than 10 seconds, have multiple page views, or result in conversions.
- Events per Session: Average number of tracked events per session, indicating engagement levels.
- Page Views: Most viewed pages or screens, helping highlight popular content.
Use Cases:
- Content Strategy: Understand which pages or content types keep users engaged.
- User Experience: Identify drop-off points to improve user experience and reduce bounce rates.
c. Monetization Reports
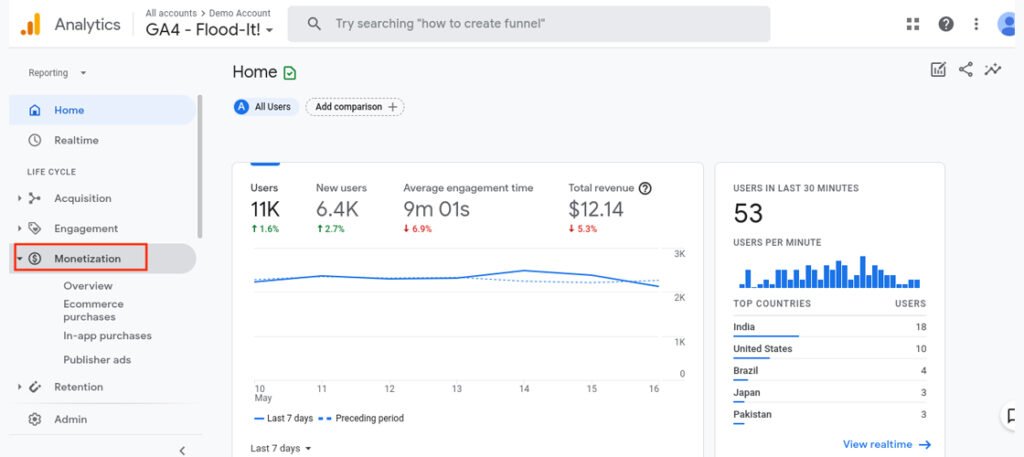
Overview: GA4 monetization reports are primarily designed for eCommerce and monetized websites, these reports track revenue-generating events. They cover online purchases, in-app purchases, subscriptions, and other forms of monetization.
Key Metrics:
- Total Revenue: Tracks the total revenue generated from user interactions.
- Purchases: Number of purchase events, along with related revenue data.
- Average Purchase Value: Average amount spent per purchase event, providing insight into user spending behaviour.
Use Cases:
- Sales Funnel Optimization: Determine which steps in the buying process need improvement.
- Revenue Analysis: Identify which products or services are most profitable.
d. Retention Reports
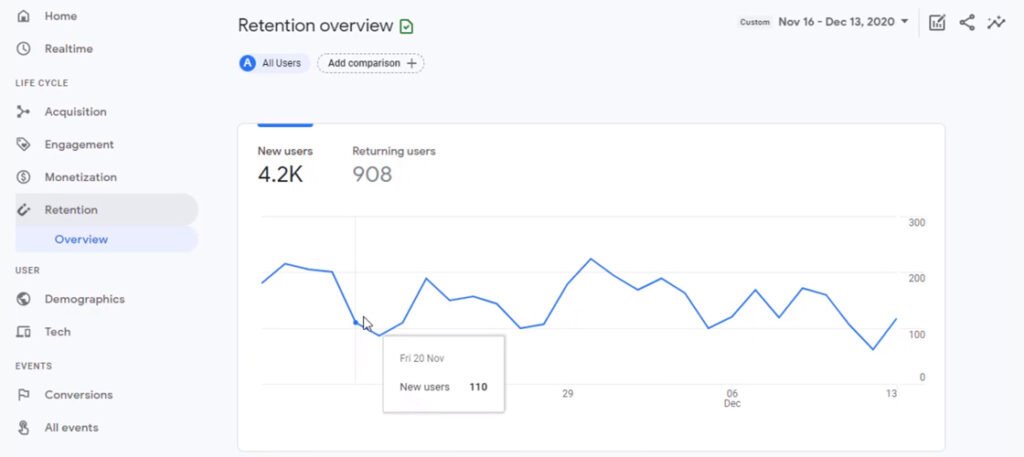
Overview: Google analytics 4 retention reports help you understand how effectively you’re retaining users over time, tracking users who return after their initial visit.
Key Metrics:
- User Retention Rate: Tracks the percentage of users returning over specified periods, such as 1-day, 7-day, and 30-day intervals.
- Engaged Users: Monitor which content brings users back, indicating higher retention.
Use Cases:
- Loyalty Programs: Gauge the effectiveness of loyalty programs or retention strategies.
- User Experience Improvements: Identify aspects of your service or product that keep users coming back.
3. User Reports
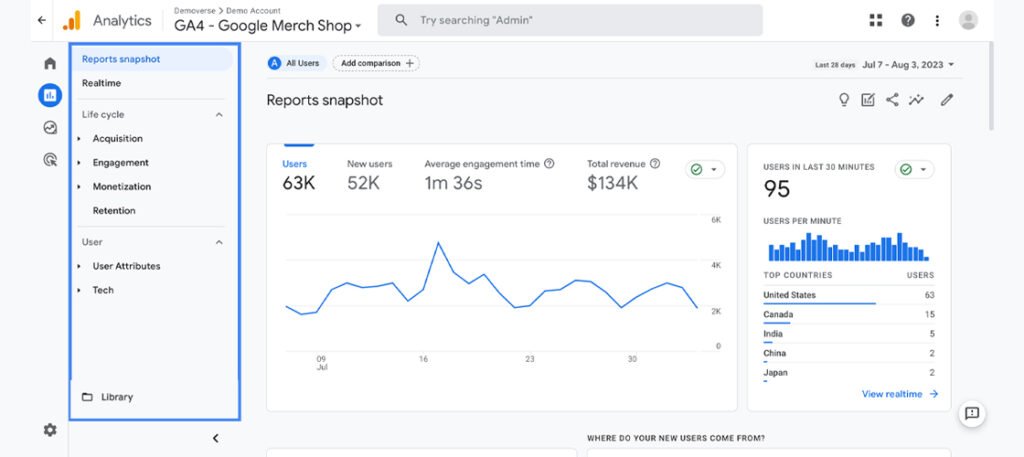
Overview: The User Reports in GA4 are built to provide a more in-depth understanding of who your users are. These reports include demographic and technology information, showing which regions, devices, and operating systems your users are coming from.
Key Metrics:
- Demographics: Age, gender, language, and geographic location data.
- Device: Device categories, operating systems, and browsers.
Use Cases:
- Audience Segmentation: Refine your targeting and tailor content to specific demographics.
- Device Optimization: Optimize your website for the most frequently used devices and browsers.
4. Events Reports
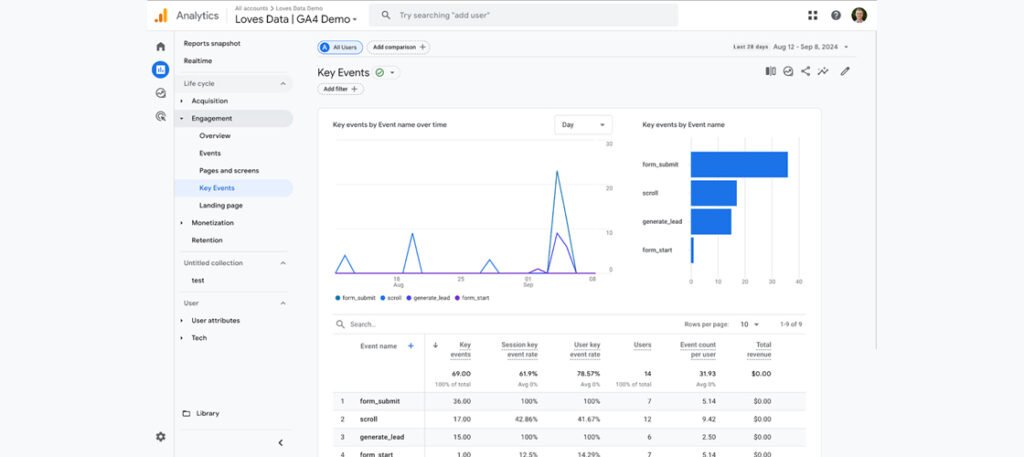
Overview: Events are at the heart of GA4’s tracking model, capturing every user interaction as an event. Google Analytics event reports provide a breakdown of specific actions users take, allowing for custom tracking of unique actions beyond page views.
Key Metrics:
- Event Count: Total occurrences of each event.
- Event Parameters: Custom details associated with each event, such as video views or clicks.
Use Cases:
- User Interaction Analysis: Track specific behaviours like clicks, scrolls, or downloads to gain insights into how users engage with your content.
- Conversion Optimization: Identify key actions leading to conversions and optimize them to improve conversion rates.
5. Conversion Reports
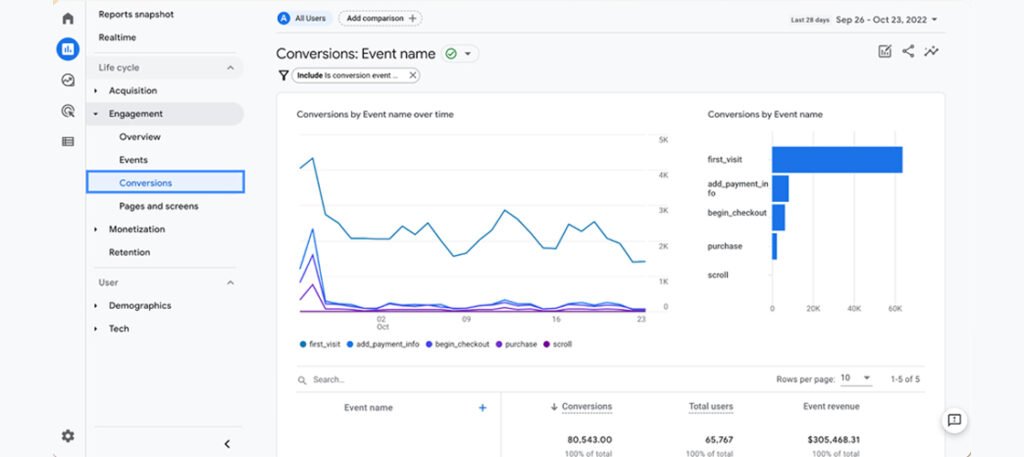
Overview: Google analytics conversion reports focus on actions that are critical to your business’s success. In GA4, you can set up custom conversion events and track the performance of each, giving insight into your conversion funnels.
Key Metrics:
- Conversions: Total number of conversions and conversion rate.
- Conversion Value: Revenue or value associated with each conversion.
Use Cases:
- Campaign Performance: Assess which campaigns lead to the most conversions.
- Conversion Path Analysis: Optimize the conversion funnel by understanding which steps are most effective.
6. Explorer (Custom Reports)
Overview: GA4’s Explorer reports allows for in-depth, custom reporting. It includes tools like Path Exploration, Funnel Analysis, Segment Overlap, and Free-Form Reports to allow businesses to dive deeper into specific user behaviors and journeys.
a. Path Exploration
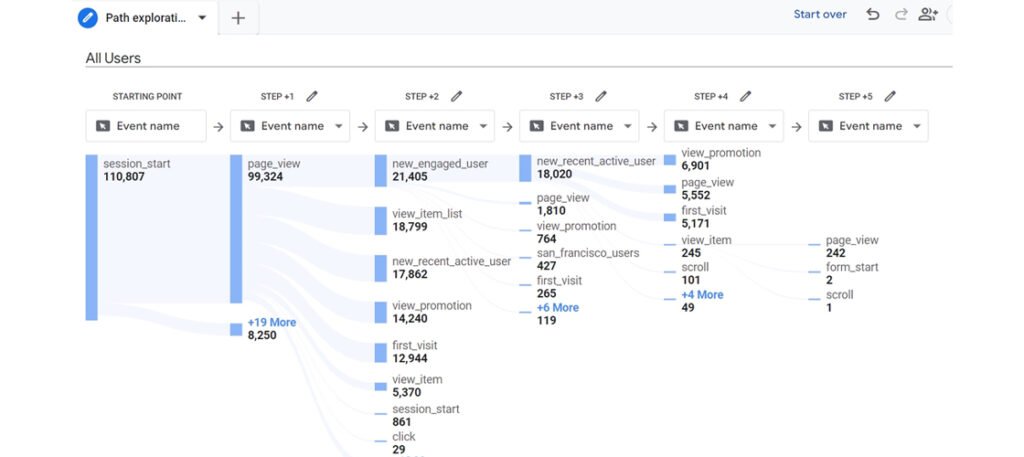
- Description: Path Exploration visualizes user journeys, showing common navigation paths and where users drop off.
- Uses: Optimize user journeys by understanding which paths lead to conversions and which result in drop-offs.
b. Funnel Analysis
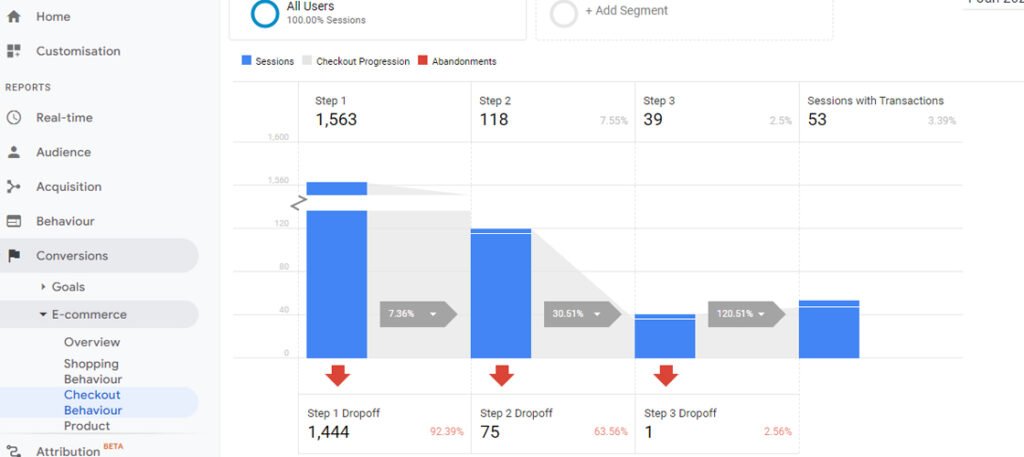
- Description: Funnel Analysis tracks user progression through specific funnels, making it easier to see how users move through conversion paths.
- Uses: Identify and improve steps in conversion funnels that may be causing user drop-offs.
c. Segment Overlap
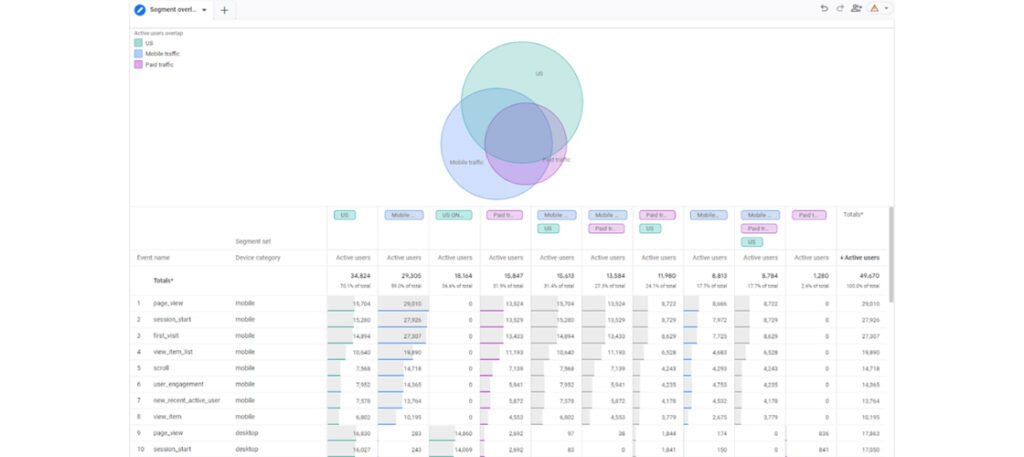
- Description: Allows comparison of user segments, showing overlapping behaviours or unique characteristics.
- Uses: Improve audience targeting by understanding similarities and differences between segments.
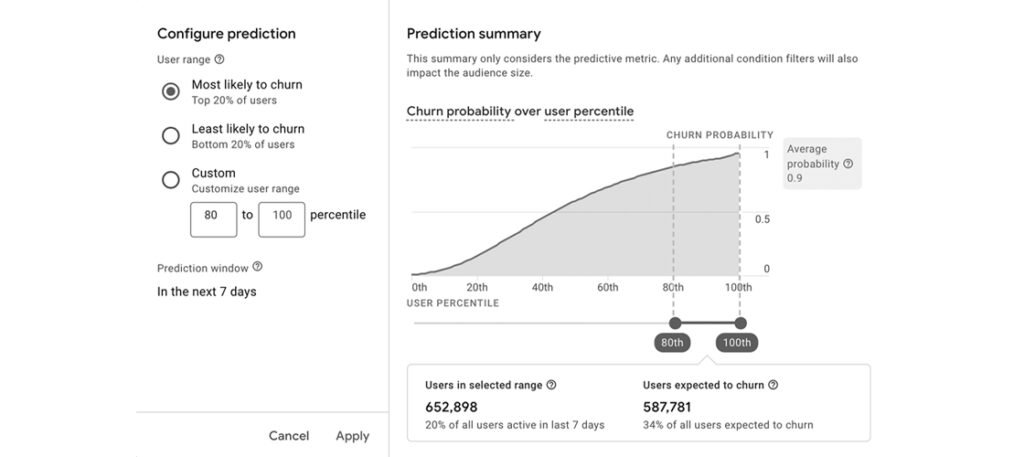
7. Predictive Metrics and Audiences
Overview: GA4 includes predictive metrics, using machine learning to forecast potential user behaviours. Metrics such as purchase probability, churn probability, and revenue prediction help businesses make data-driven decisions.
Use Cases:
- Targeting High-Value Users: Focus on users likely to convert or churn based on predictive insights.
- Marketing Optimization: Create targeted campaigns for audiences predicted to generate higher revenue.
Conclusion
Google Analytics 4 reporting tools offer powerful insights that are invaluable for businesses of all sizes. By understanding each report type, businesses can leverage data to refine their marketing strategies, improve user experience, and ultimately drive growth. Whether it’s real-time monitoring, analyzing user engagement, or creating predictive models, GA4 provides the flexibility and tools needed for effective data-driven decision-making.
